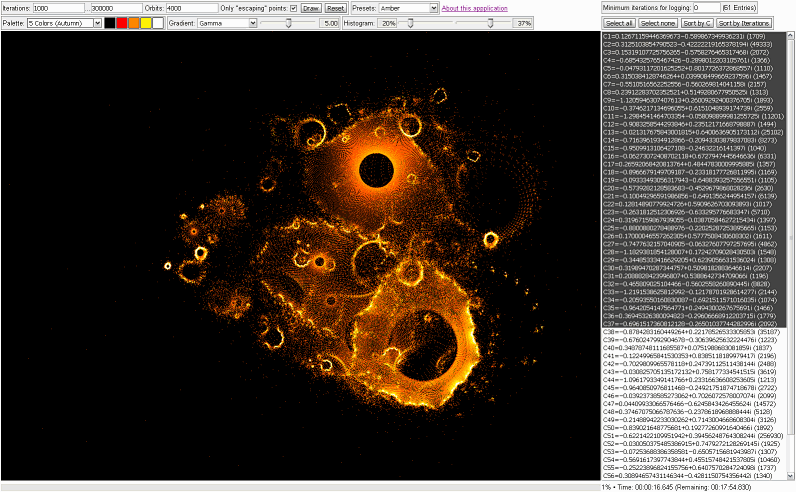
Screenshot of the JavaScript Application during the rendering process
[Z Orbits?]
[Application]
[Samples]
[Colorizing]
[Zoomed Regions]
[Gallery]
[Start the App]
What are "Mandelbrot Z Orbits"?
In the Mandelbrot iteration Z->Z²+C, Z and C are complex numbers. They can be positioned on a 2-dimensional plane, the so-called Gaussian number plane, or complex plane. Each iteration sequence starts with a randomly chosen value for C which remains constant during each iteraton, while Z starts at 0. Depending on the value of C, the value of Z will either "escape" to infinity after a certain number of iterations, or it will be "trapped" within a circle of radius 2, called the "escape radius". Each number C, for which the value of Z stays within the escape radius, belongs to the Mandelbrot set. Usually the exact values of the number Z are not considered by programs which draw the Mandelbrot set. The only interesting question is: Does it diverge (escape from the circle) or converge (stay within the circle)? Nevertheless, the different values of the number Z show are very interesting behavior. If the sequnece of the Z numbers are recorded during the iterations for a given C number, different patterns will appear on the complex plane. To visualize these "paths" of the number Z, I wrote a little tool in JavaScript:
Just drag the mouse over the complex plane above to see the red "path", or "orbit", of the number Z for the number C at the current mouse position. You can see that for starting points C outside of the Mandelbrot set, the sequence of Z numbers will sooner or later escape from the purple circle. For C numbers inside the Mandelbrot set, the corresponding sequence of Z numbers will stay inside the circle. The closer C is to the rim of the Mandelbrot set, the more complex and chaotic the sequence of Z numbers will become. Try it! – I asked myself, how would it look like if all Z values for a very large number of C values were displayed as dots on the complex plane? Would this result in any kind of interesting pattern? This was the starting point for another little JavaScript application.
The JavaScript Application
The JavaScript application chooses a certain number of random C numbers and then starts the Mandelbrot iteration Z->Z²+C for each of these C numbers. The resulting Z values after each iteration are added to the image. Each "hit" of a Z number on a pixel position adds an amount to the pixel brightness. One can choose if only the "escaping" Z values or all Z values are recorded. There are several colorization options for the resulting image. For a starting point, there is a number of "presets" which will render different types of images.

Screenshot of the JavaScript Application during the rendering process
When the "Draw" button is clicked, the image will be rendered. During this process, a progress bar will appear under the image, and right to the progress bar, the elapsed and remaining (estimated) time is displayed. After the rendering process is finished, the color options can be changed to yield the best visual result.
Sample Images (Presets)
The following images are examples for the presets which can be selected in the application. Feel free to try these presets yourself and change any of the parameters. If high numbers of maximum iterations (1 million and above) are used, each image will be different with often surprising results, like for instance the images »Ancient Machine« and »Amber« below. This is because a high number of iterations causes very long sequences of Z values, which result in "macroscopic" forms like ring-shaped objects or curved chains of dots, rather than uniformly distributed random pixels. Sometimes the results are boring, but sometimes very feature-rich and detailed images are created.
Be cautious with the "Minimum iterations for logging" value: If it is too low, too many C points will be logged, causing the browser to abort the script with an "out of memory" error. This will probably happen it the list grows to more than 200k entries. So if the program suddenly stops working, you can open the JavaScript console (Ctrl+K in Firefox) to see the error message. In this case, choose a higher value. If the value is greater than the maximum number of iterations, no C points will be logged at all.
Please also allow the application so run for several minutes or even hours – depending on the speed of your computer and the number of iterations and random points.
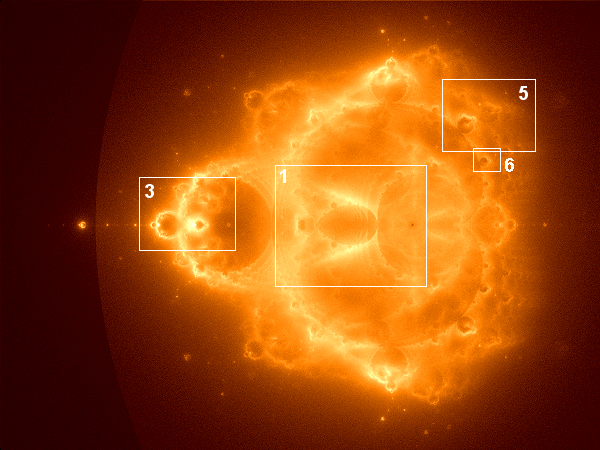
Iterations: 0 ... 1000, Orbits: 100 million, Only "escaping" points: Yes,
Colors: #000000 #400000 #FF8000 #FFFFA0 #FFFFFF, Gradient: Logarithm, Value: 3.90, Histogram: 20% / 0%
Like a normal Mandelbrot set, it's possible to "zoom" into the picture in order to magnify certain regions of the main image. Here are some examples of zoomed regions.
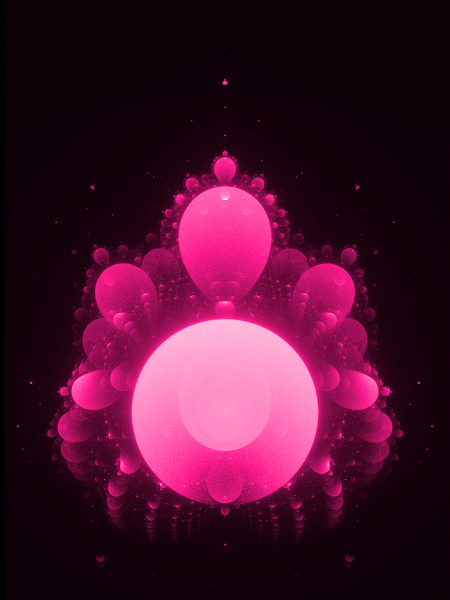
Iterations: 0 ... 1000, Orbits: 100 million, Only "escaping" points: No,
Colors: #000000 #FF1C8D #FFFFFF, Gradient: Logarithm, Value: 5.30, Histogram: 0% / 0%
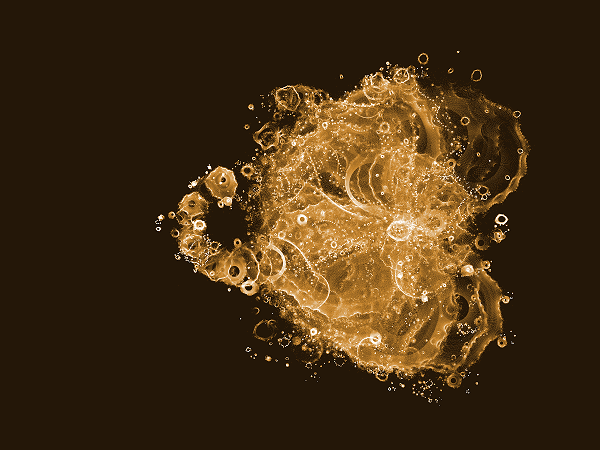
Iterations: 10k ... 300k, Orbits: 200, Only "escaping" points: Yes,
Colors: #241709 #CD8B32 #FFFFFF, Gradient: Auto-Logarithm, Value: 5.60, Histogram: 10% / 35%
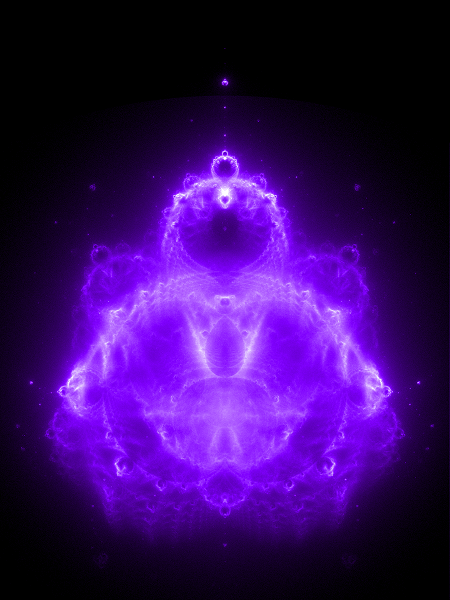
Iterations: 0 ... 10k, Orbits: 200 million, Only "escaping" points: Yes,
Colors: #000000 #8000FF #FFFFFF, Gradient: Logarithm, Value: 3.60, Histogram: 24% / 22%
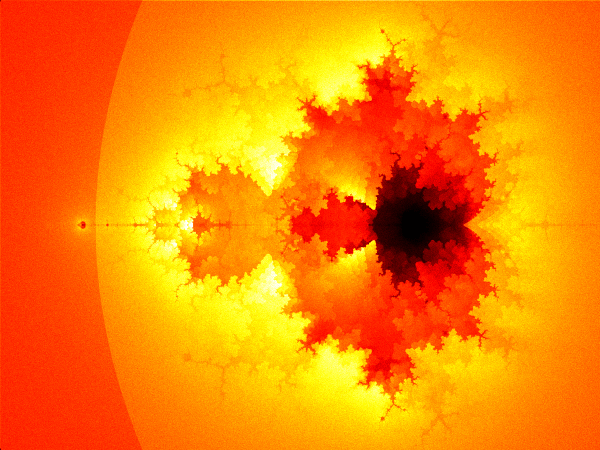
Iterations: 0 ... 20, Orbits: 100 million, Only "escaping" points: Yes,
Colors: #000000 #FF0000 #FF8000 #FFFF00 #FFFFFF, Gradient: Sinus, Histogram: 0% / 20%
With 1 billion (= 10 times as many) orbits, the picture becomes less "noisy", but the computing time also increases by the factor 10:
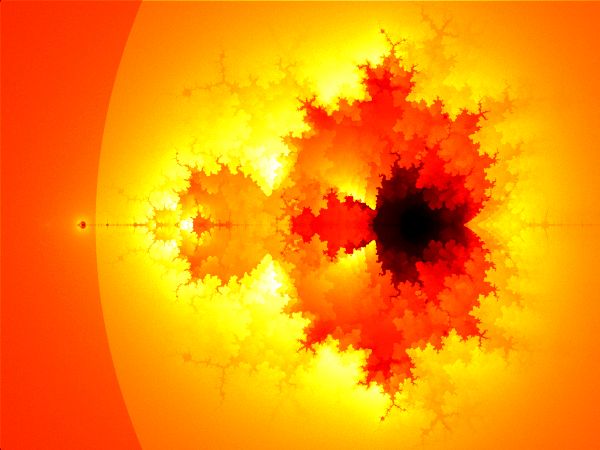
Iterations: 0 ... 20, Orbits: 1 billion, Only "escaping" points: Yes,
Colors: #000000 #FF0000 #FF8000 #FFFF00 #FFFFFF, Gradient: Sinus, Histogram: 0% / 20%
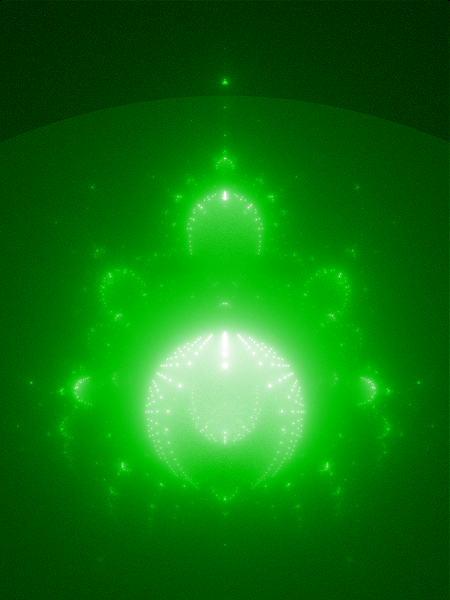
Iterations: 0 ... 20, Orbits: 100 million, Only "escaping" points: No,
Colors: #000000 #00C000 #FFFFFF, Gradient: Auto-Logarithm, Histogram: 39% / 15%
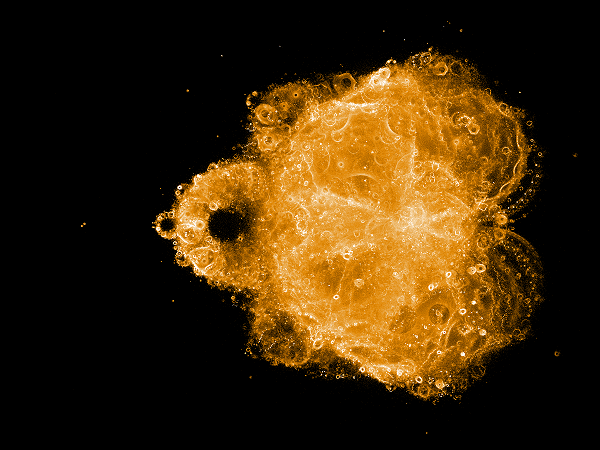
Iterations: 1000 ... 1 million, Orbits: 10 million, Only "escaping" points: Yes,
Colors: #000000 #E28701 #FFFFFF, Gradient: Gamma, Value: 5.00, Histogram: 20% / 37%
Colorizing Z Orbits
In order to colorize different Z orbits, three images can be combined to one color image. Here I used "Paint Shop Pro 7" to combine three single images (created using the preset "Ancient Machine", but with colors #000000, #808080, #FFFFFF and only 100 Orbits) to one color image:
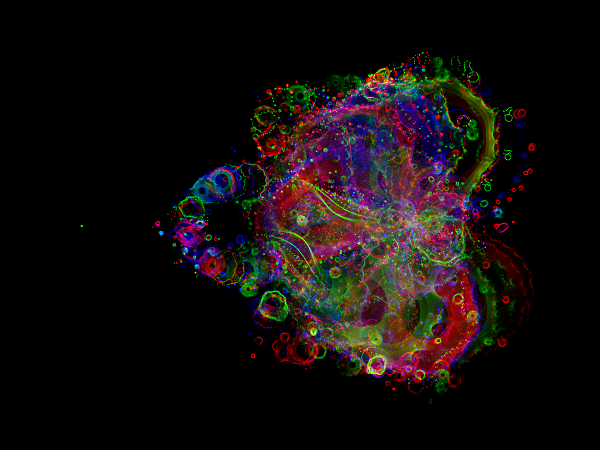
A Z Orbit image with 3 colors
Each single greyscale source image has been assigned to one color channel (red, green, blue). To have more than 3 colors in the resulting combined image, the source images should share a number of orbits. Shared orbits will be displayed in a mixing color, e.g. yellow if contained in the two images which are assigned to the red and green channel.
Here's an example with 6 colors (red, green blue, and the mixing colors yellow, cyan and magenta):
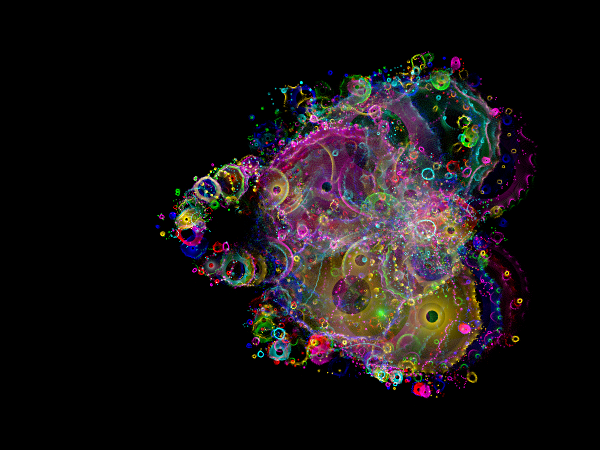
A Z Orbit image with 6 colors
Homepage > Mandelbrot Set in JavaScript > Experiments > Mandelbrot Z Orbits